Note
This technote is not yet published.
AuxTel pointing determination and CWFS measurements show non-repeatability and high-order dependencies. This technote describes the actions taken to diagnose the issue and implement a fix.
1 Observed Behavior
Struggled to obtain reliable and repeatable pointing of the Auxiliary Telescope
Believed early-on that it was mostly due to inaccuracies in measurements and due to the M1 and M2 LUTs not be sufficiently stable due to a poor sampling of the observing range and/or poor fits to that data
Significant time has been spent to accumulate more data for the pointing model, details are found in the pointing_technote. The main conclusions are two-fold.
- There is a high-order “wiggle” around 30-40 degrees in elevation that is not well fit. This can be seen in the central plot of the following figure. It is also present in the center-left plot but is less obvious. The pointing component is better suited to smooth behaviors, so which this is not.
- There is significant scatter in the pointing observations, even for the same telescope position. Values can be up to 30 arcsec. This indicates a non-repeatable component in one of the mirror positions.
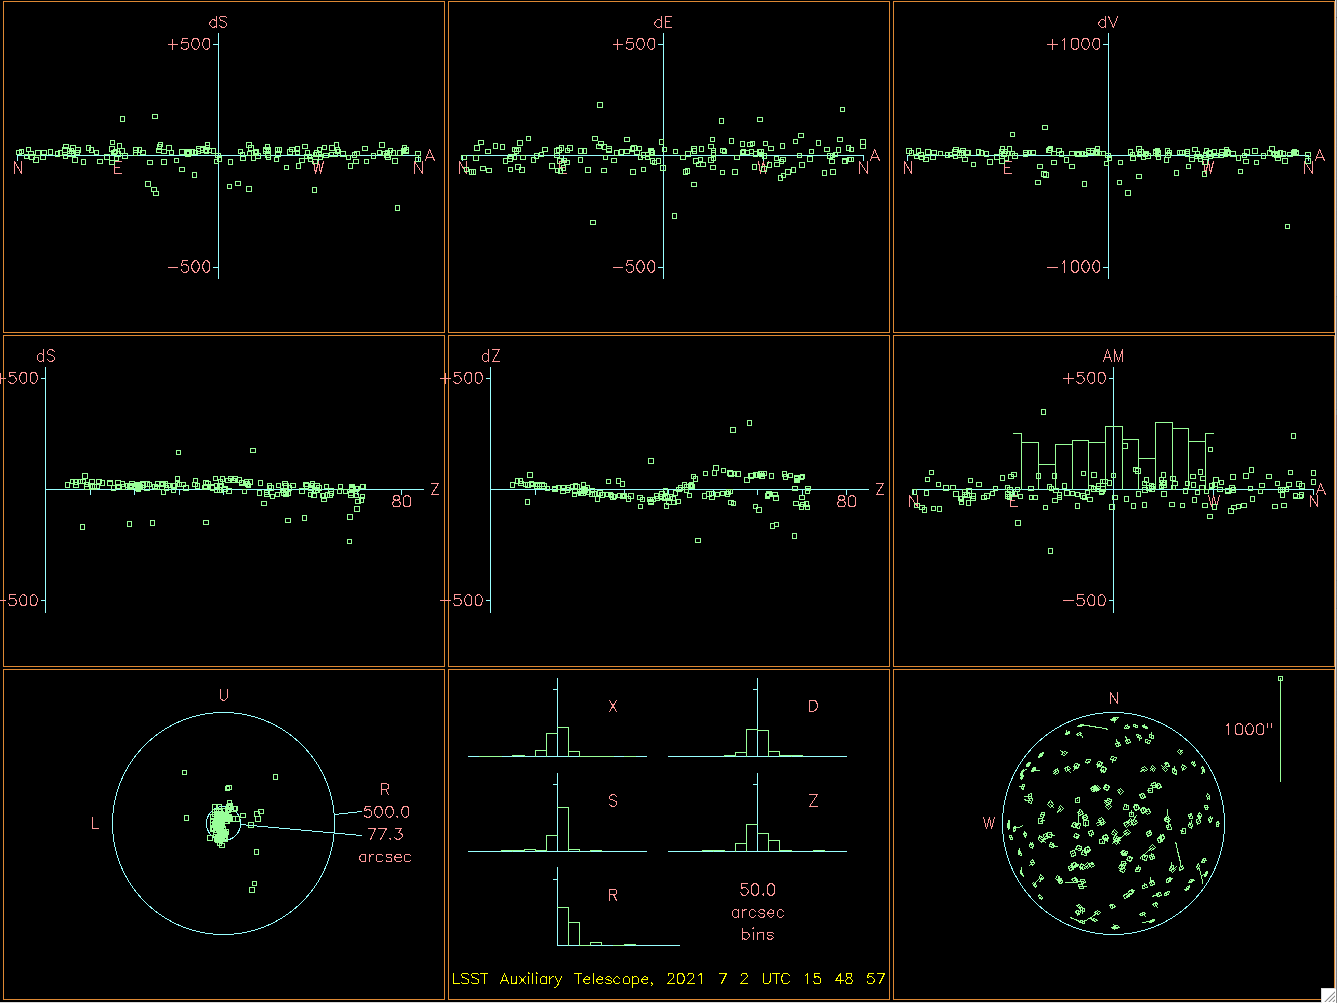
Figure 1 The “9 favorite plots for alt-azimuth”. This plot gathers the 9 most relevant plots with information about the pointing model fit for an altaz mount. Top-left-hand: The east-west residuals plotted against hour angle. Top-center: The declination residuals plotted against declination. Top-right-hand: Zenith-distance errors against zenith distance. Center-left-hand: The east-west residuals plotted against zenith distance. Center: The declination residuals plotted against hour angle. Center-right-hand: The residuals are interpreted as changes in the h/δ non-perpendicularity and plotted against hour angle.
- Significant time has also been spent accumulating data to create an M2 position look-up table. This is completed by performing CWFS measurements at multiple elevations. Again, there is scatter in the data that corresponds to about 0.2 mm of hexapod motion, which is equivalent to ~30 nm of WFE.

Figure 2 The accumulation of multiple datasets where we measured the hexapod position as a function of elevation.
- Until recently, there has been no other external measurement to help constrain the problem.
- We currently have no temperature sensors, however, there have been nights where the temperature remains stable and these effects are still seen. For the data discussed below the temperature increased ~8 degrees C but then held stable for ~6 hours which is when we took the data.
- Hexapod corrections only include translation and piston (focus). No tilt correction is currently applied, up to now, it has been assumed that this is best is taken out by the pointing model. The tilt is currently set to what was measured by Roberto during optical alignment
2 Information from the Optical Model
During the last run a dataset was taken both translating and tip/tilting the hexapod.
For each datapoint, the hexapod was moved by a set amount, and CWFS datasets were taken to measure the induced aberration(s).
These were then compared against the optical model. For this analysis, the most important information is as follows:
- For M1, a 1mm lateral shift of the mirror results in ~65 arcseconds of image motion. Confirming this experimentally is really hard as we must adjust the belly-band manually and therefore we have not done it.
- For M2, a 1mm displacement results in 54.7 arcsec of image motion. Experimentally we measure ~52.5 and ~50.5 in X and Y.
- For M2, 0.0022 degrees (8 arcsec) of tilt results in 30 arcsec of image motion For the 266mm diameter mirror this corresponds to 0.33 mm of (roughly) vertical motion. This has not been verified experimentally, although the data exists to do so.
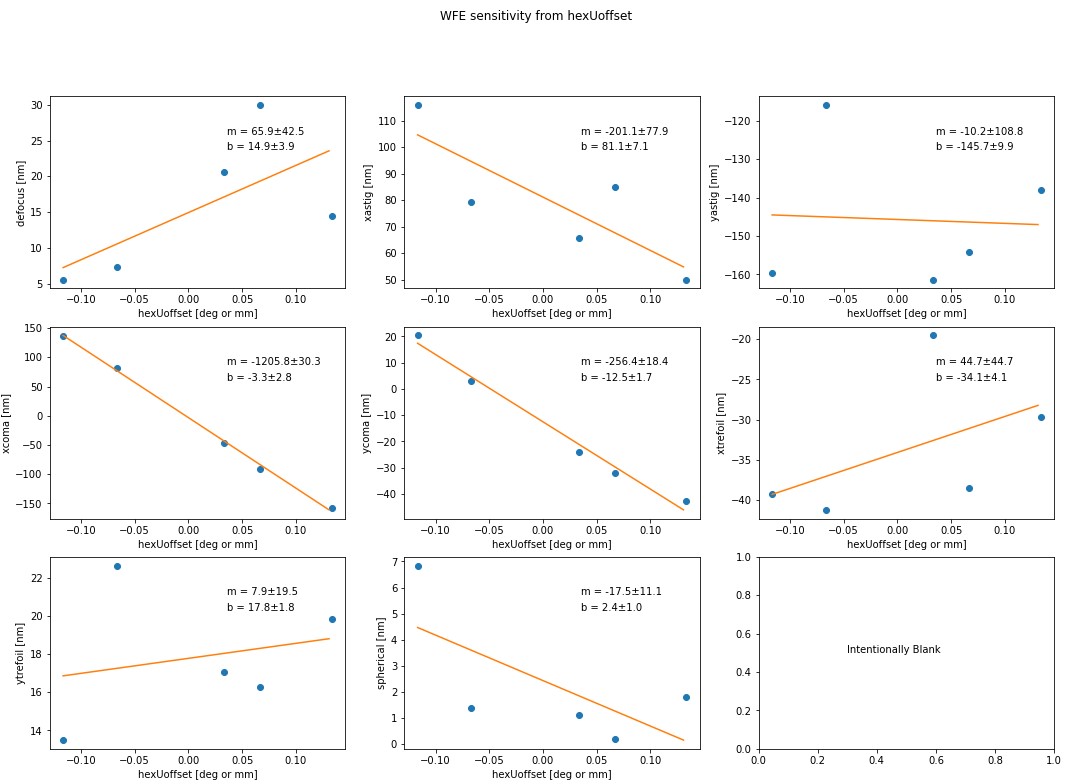
We have experimentally measured the WFE induced by tipping/tilting M2, and by translating. The following figure shows the effects of translation of the hexapod X-axis, which is aligned with the gravity vector
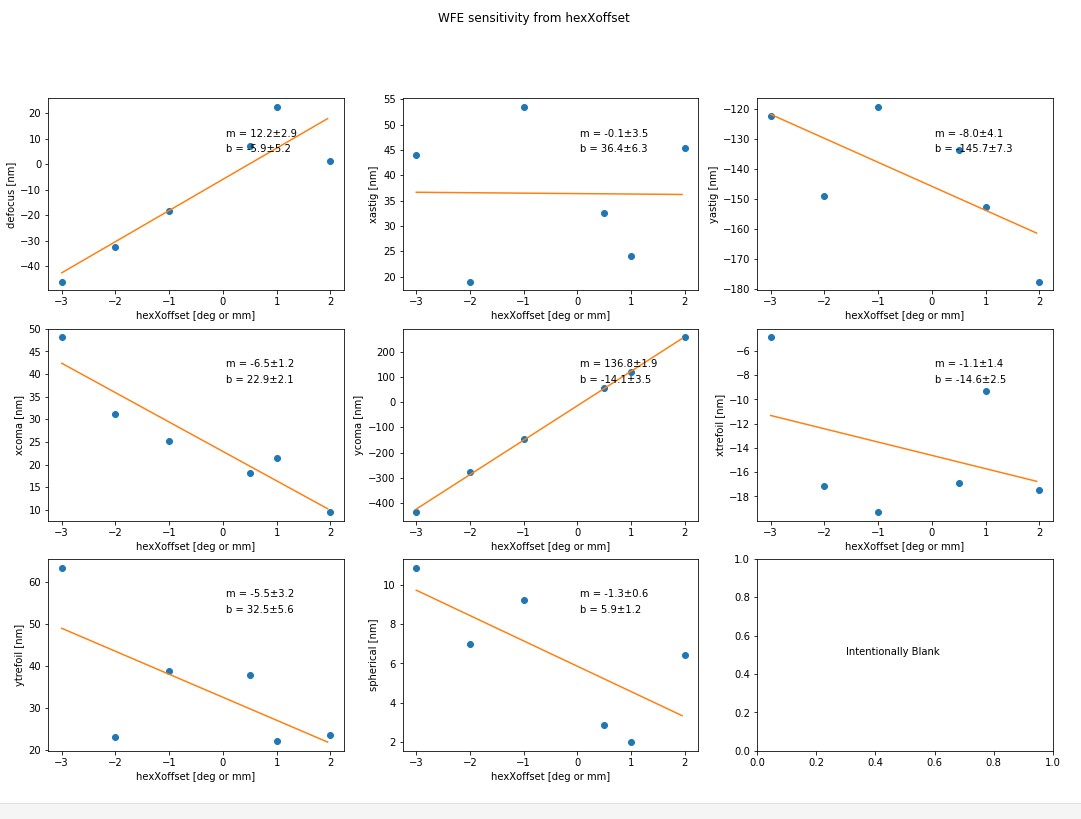
Figure 3 The WFE induced by translating the AT M2 hexapod in the X-axis. The Y-axis is the same in magnitude but the axes of the aberrations are flipped. Note that previous datasets have yielded ~30% higher slopes, so note that there may be uncertainty here.
- The next figure shows the effect of tipping (rotation in U, which is about the Y-axis). Rotation about the X-axis is the same magnitude but the aberrations are seen in the other axis (e.g. Coma-X instead of Coma-Y)
3 Efforts to Isolate the Issue(s)
- Decided to spend time investigating both image motion and hexapod repeatability using a single concentrated dataset
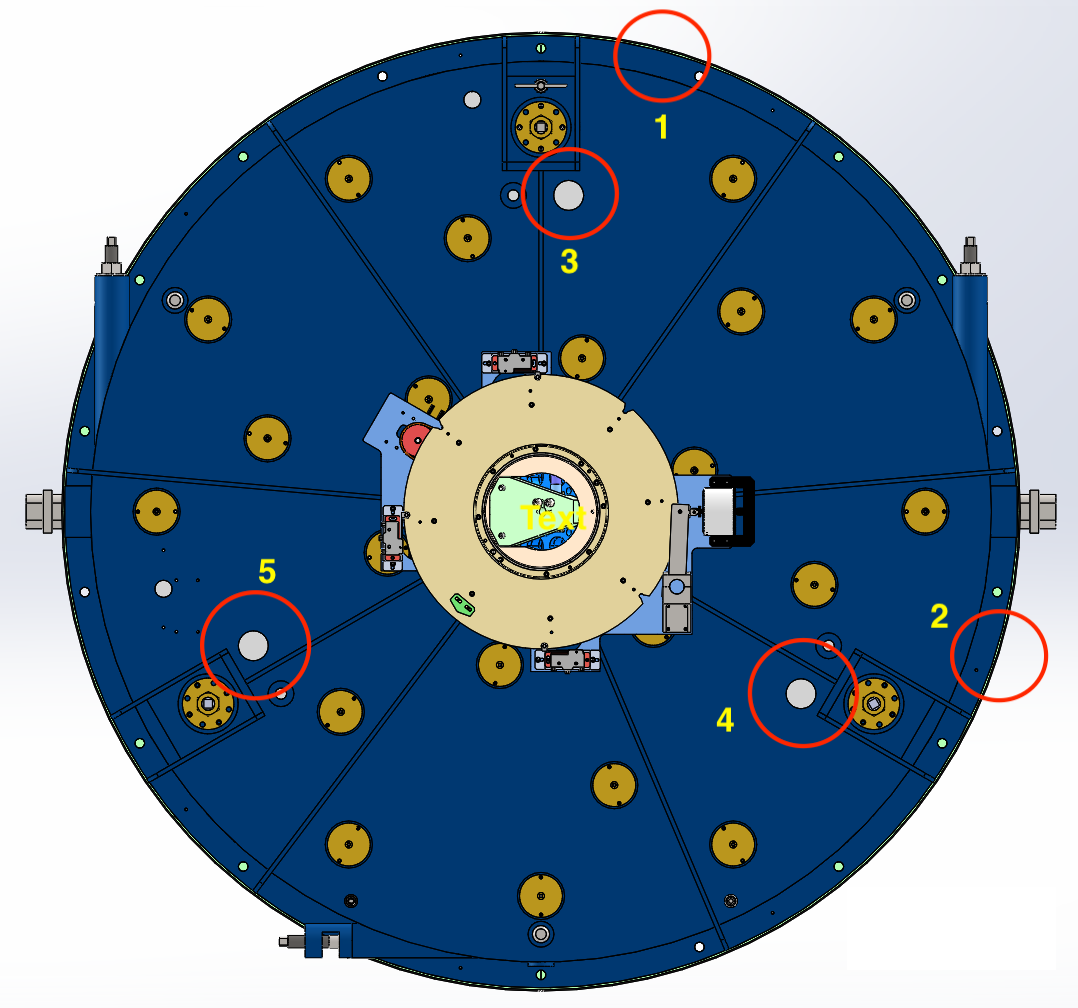
- For this run, we have installed 3 micrometers on the M1 mirror to measure translation in all three axes.
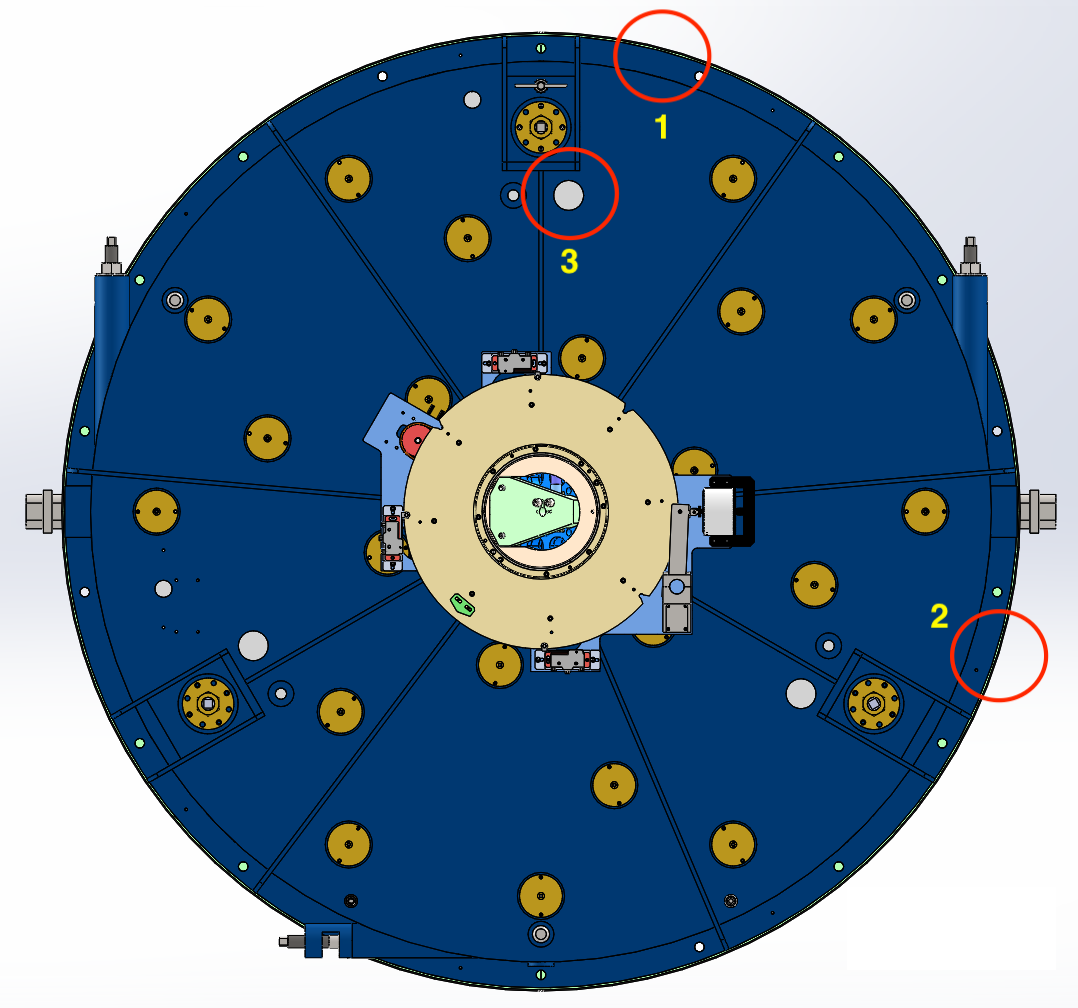
Figure 5 Mitutoyo dial indicators have been positioned to in these locations to measure primary mirror motion as a function of elevation.
- A dedicated dataset was taken moving up and down in elevation continually taking CWFS datasets to look at hexapod motion An in-focus image was also taken to observe the repeatability in the pointing
- Based on impromptu testing and some back of the envelope calculations, it was hypothesized that the top end was possibly loose. We currently lack instrumentation to diagnose this effectively, but people are trying to secure cell phones to the spiders and tap them to measure the fundamental frequency, essentially to determine if any are loose. This is on-going.
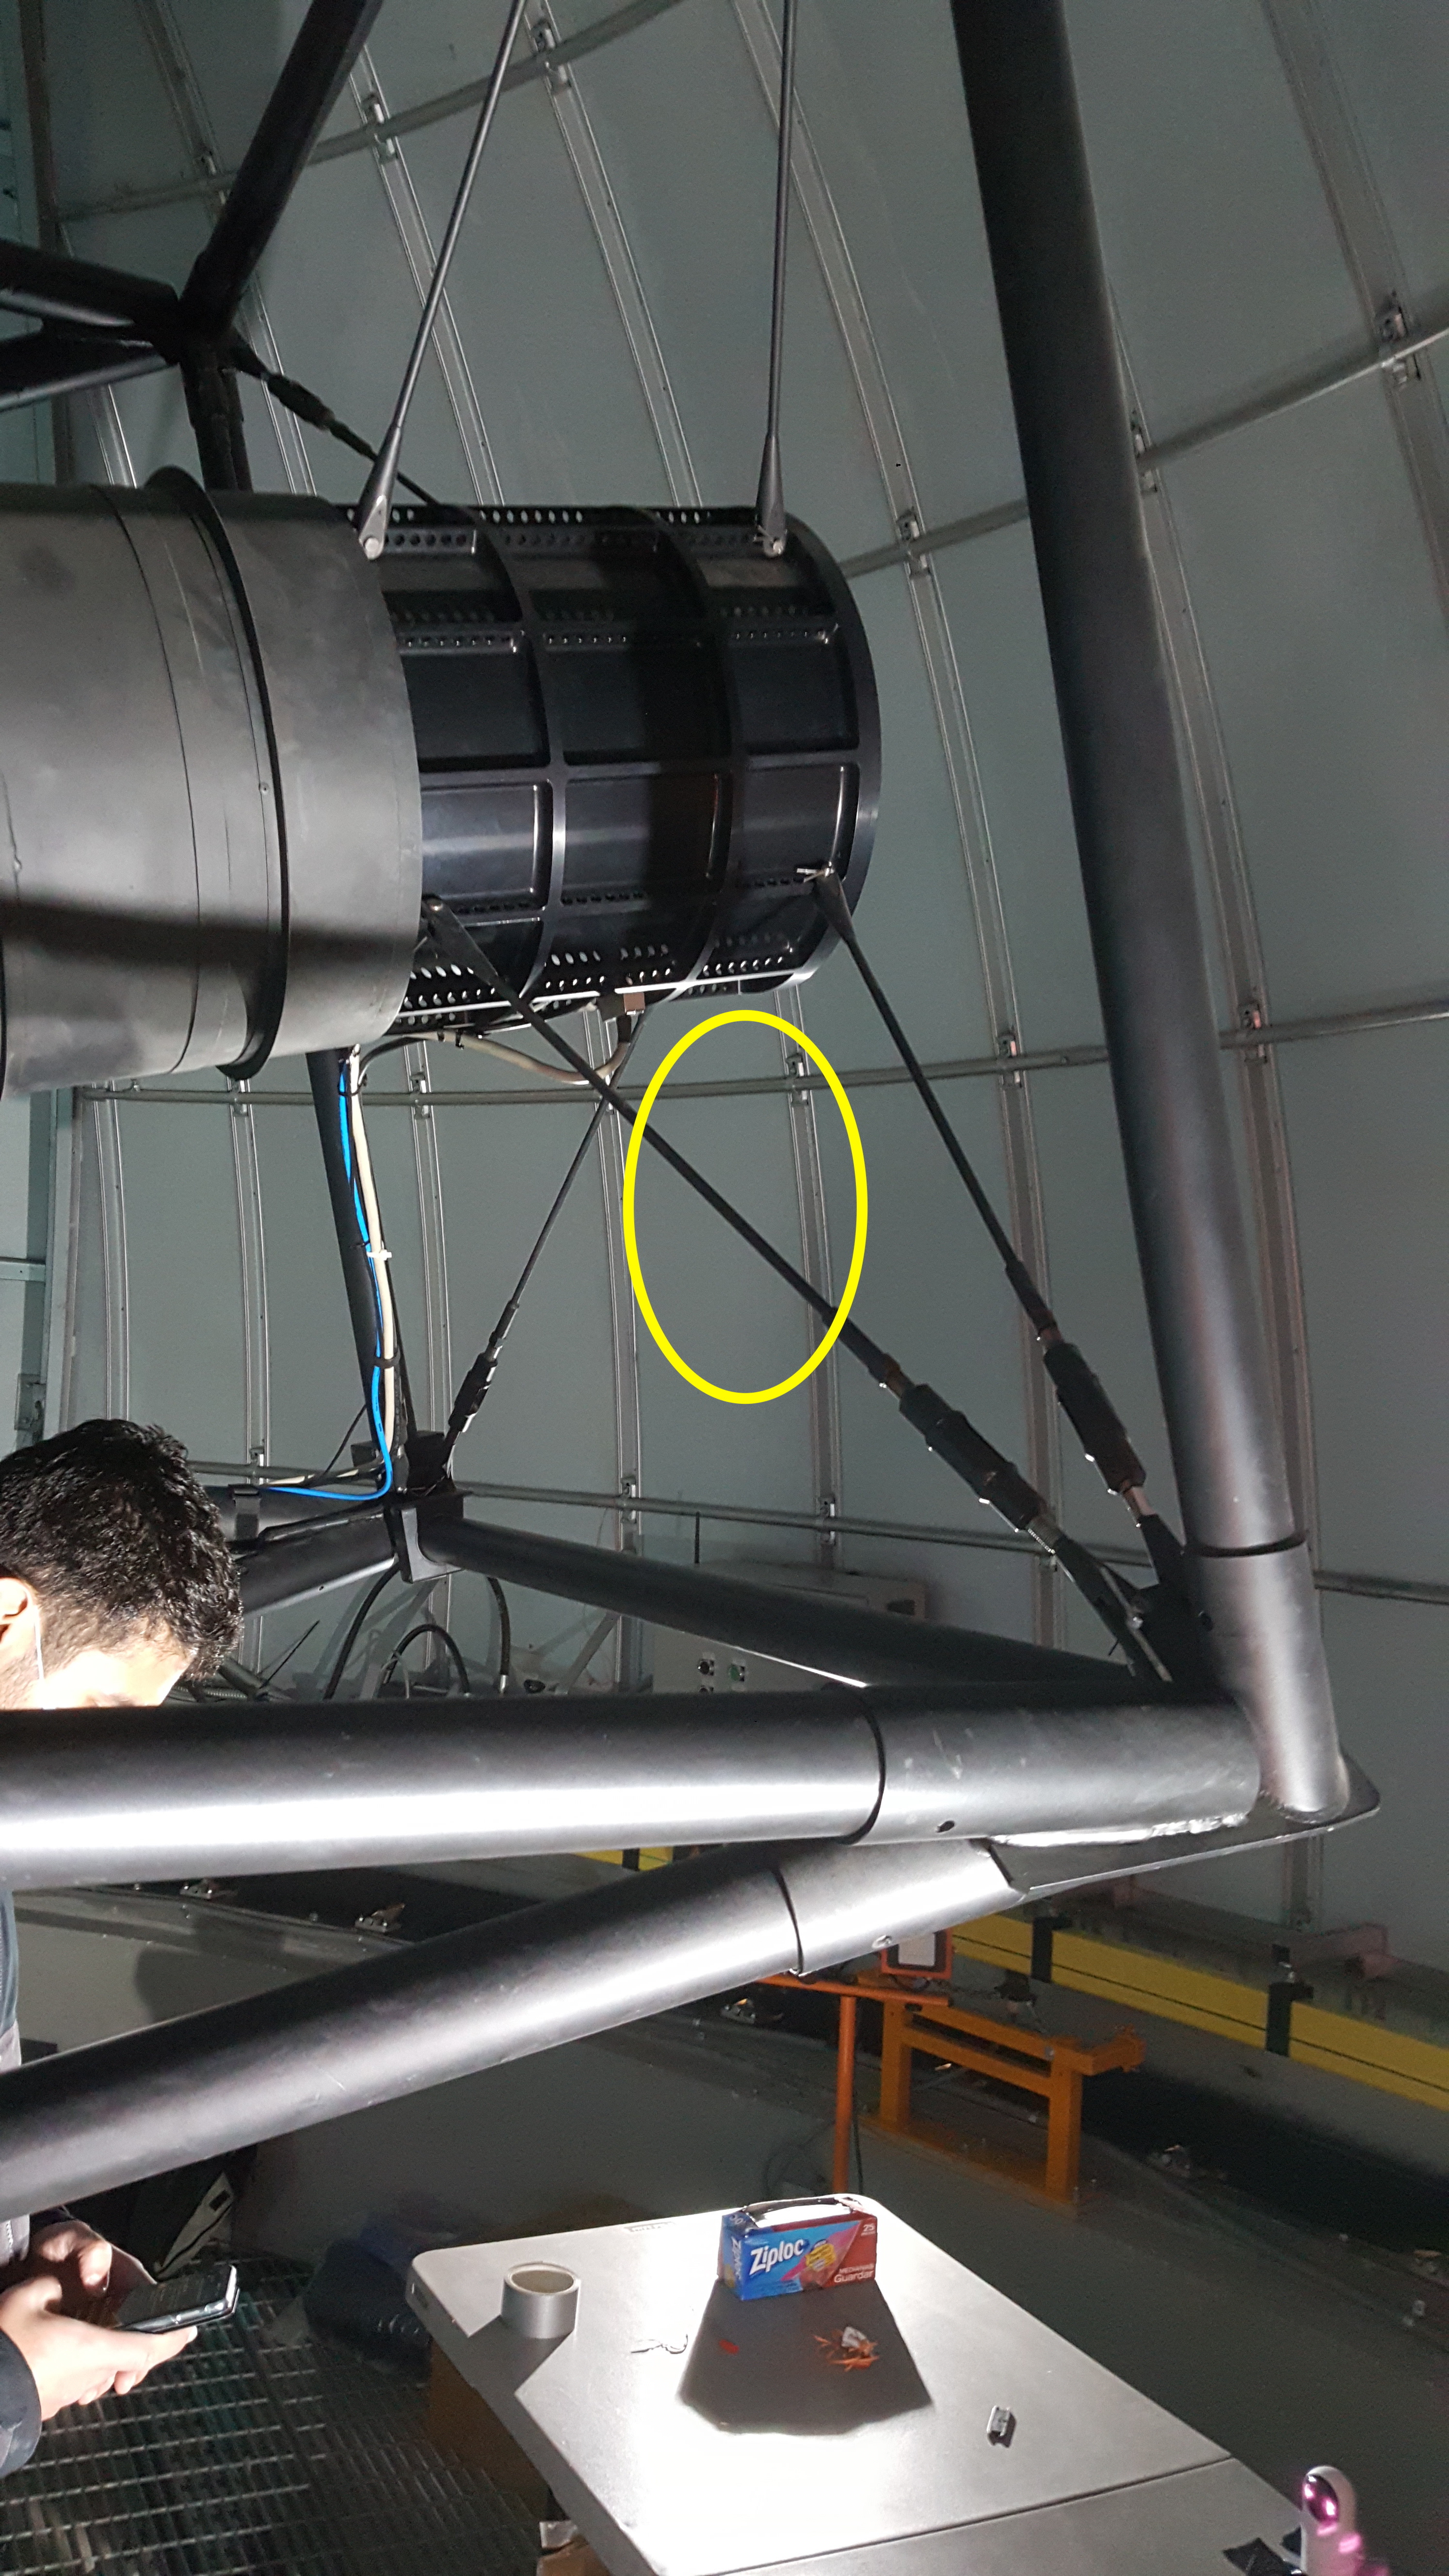
- Initial tests have shown excessive vibration in the spider vane (turnbuckle) in the following image. When tapped, this strut would vibrate for 1-2s, whereas the others had no discernible vibration
4 Mirror Motion from dataset on the night of July 6, 2021
- The following data have been collected by moving up and down in elevation and performing CWFS measurements and subsequently applying the corrections to minimize WFE. This basically collimates and focuses the telescope at each position.
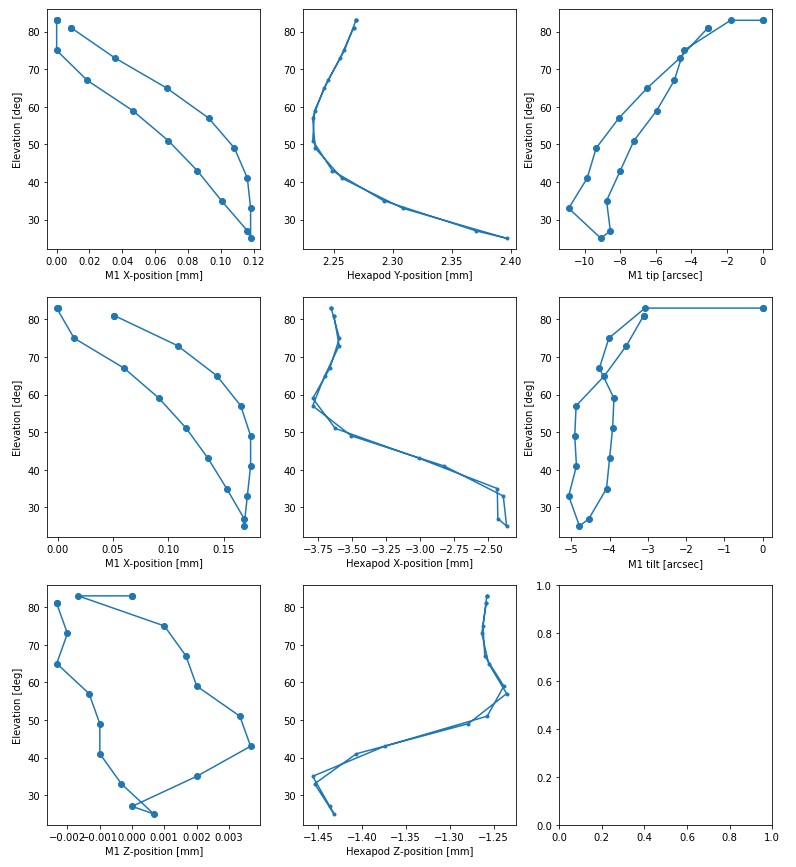
- The following plot shows the M1 mirror and M2 hexapod position as a function of elevation after a few dips
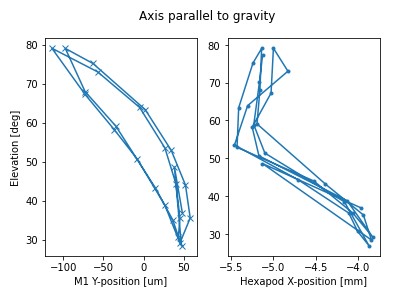
Figure 7 Mirror motion along the elevation axis. The M1 motions (left) show a smooth hysteresis curve with a separation of ~0.05 mm. The M2 motions show a ~0.2mm RMS scatter, primarily at high altitude. The M2 motion is also not a low-order smoothly varying function.
- The following plot shows the M1 mirror and M2 hexapod position as a function of elevation for the same dataset, but now showing the axis perpendicular to elevation (and not aligned with gravity).
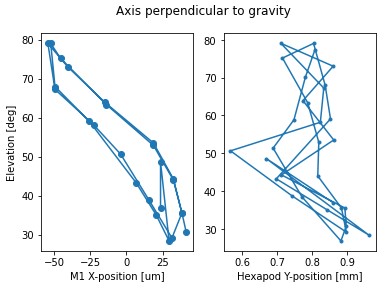
Figure 8 Mirror motion perpendicular to the elevation axis (and gravity vector) The M1 motions (left) show a smooth but reduced hysteresis curve with a separation of ~0.03 mm. The M2 motions show a ~0.2mm RMS scatter; the elevation dependence is less clear. Again, the M2 motion is also not a smoothly varying function.
4.1 Motion Summary
Based on the observed motions we can use the sensitivity matrices to calculate their contributions
- M1 motion of 0.05 mm is the same as displacing M2, therefore assuming a worst case scenario this would result in 139*0.05 = 7 nm of WFE without correction and ~2.6 arcsec of image motion. In reality because this is a smooth function it is probably lower than this. It is believed that M1 lateral displacement cannot be the source of the large non-repeatability.
- M2 “random” motion in each axis of 0.2 mm RMS results in a WFE of ~28 nm. This also results in ~10 arcsec of pointing error per axis The PSF motion (pointing error) from this dataset has not yet been completed, however, based on the pointing model deviations of ~30 arcsec, it is anticipated that a tip/tilt motion is also required to account for this.
- If we assume 20 arcsec of pointing error comes from tip/tilt, this would result in only 0.9 nm of WFE, which we’d never be able to measure
- Based on the vibration data, a loose top-end seems consistent, but is very inconclusive
- The spec for the telescope pointing requirement is 10 arcsec over the entire sky. The non-repeatability needs to be addressed to meet this requirement. M1 lateral motion will eventually limit pointing accuracy but is not currently a significant contribution to the error budget.
4.2 Conclusions based on data to date
- A single measurement device on the back of M1 is not sufficient. It is possible that the mirror is tipping/tilting and we can’t sense it. This could be from belly band slippage and therefore applying a lateral torque or from the mirror being lifted and moving.
- The top end needs to be torqued.
5 Daytime work of July 6, 2021
More mitutoyo sensors added, now have 5 sensors to get full M1 mirror motion measurements (except rotation).
The physical positioning of the sensors that is used in fitting the place representing the mirror is shown _static directory having the filename(s) of “mirror_sensor_position_measurementX.jpg”
6 CWFS repeatability from dataset taken July 7, 2021
Reduced using July7CWFSNotebook.
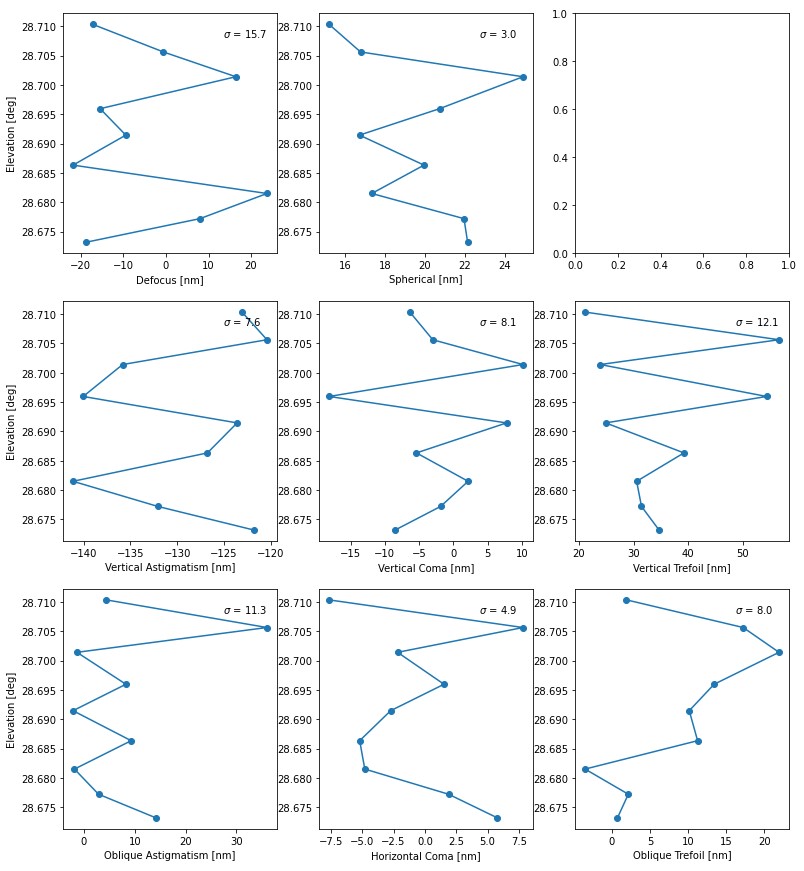
Took 10 CWFS sequences, correcting after each sequence, at a target near the pole where there was essentially no motion.
Following figure proves no telescope motion during the dataset
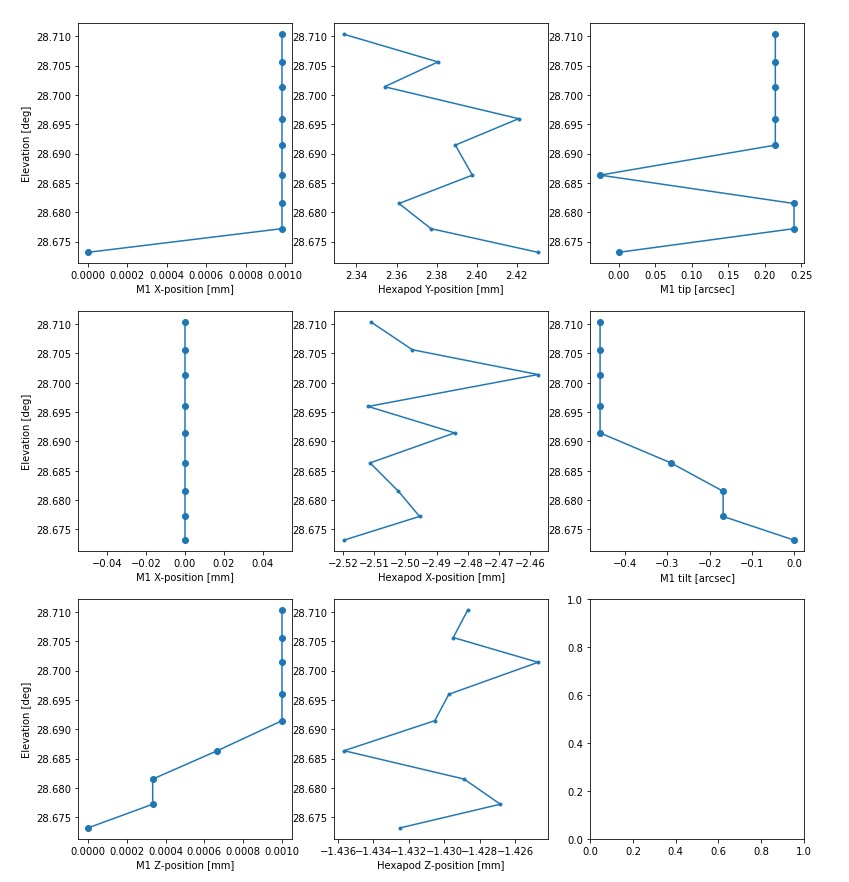
Figure 10 The amount of telescope and hexapod motions measured for 10 consecutive sequences. The telescope basically remains stable. The hexapod motion is due to corrections from the CWFS iterations.
The zernike measurements represents the amount of “noise” whenever CWFS data is taken. Note that this is a single instance, therefore if there is a dependence upon dome or mirror seeing then this may be an inaccurate measurements. This is especially true if the seeing components are small.
7 Mirror Motion from datasets from July 7, 2021
Reduced using July7Notebook.
Took data going up and down in elevation in attempts to build a LUT for the hexapod and a new pointing model. Note that the CWFS corrections were always applied. This is basically the same exercise as we performed on July 6th except now with more mirror telemetry and a better pointing model.
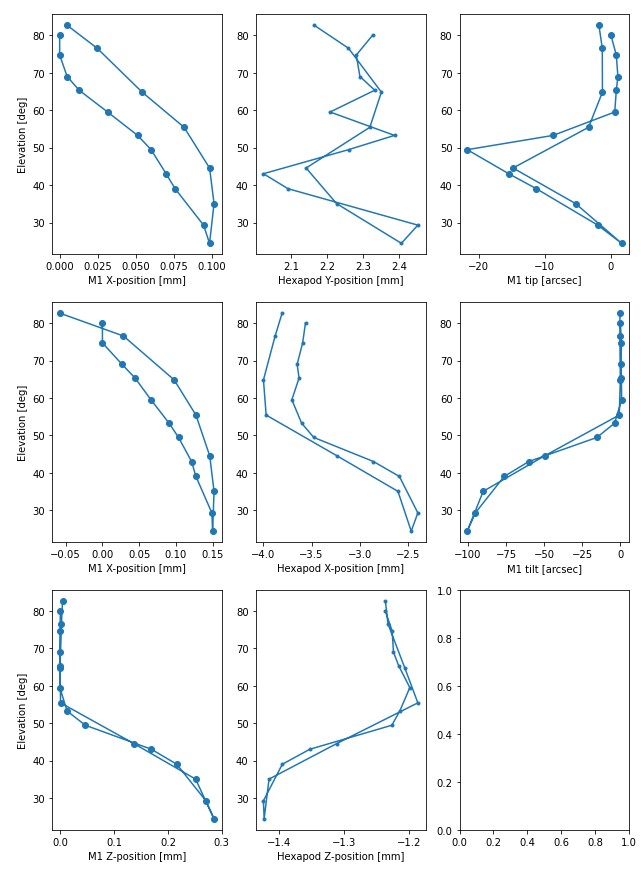
Figure 12 Measurements taken to derive a LUT for the hexapod taken with the M1 position measurement system in place. There is significant scatter in the hexapod positions as well as a systematic offset (in X) between going down in elevation and coming back up.
7.1 Conclusions based on data to date
- A very significant tip/tilt of M1 is occurring that shows evidence of hysteresis. This is correlated with the shape of the M2 hexapod motions and therefore the effect is being partially corrected. This dataset does not directly capture the pointing error since the collimation was redone for each position.
- The sharp features in the motions mean polynomial fit to a LUT will never work very well. The issue needs to be fixed at the source (M1) and the hexapod LUTs remade.
- Non-repeatability in M1 positions (mostly tip/tilt but also translation) will also result in “noise” in the hexapod LUT data, and therefore create a “scatter” that will never be improved.
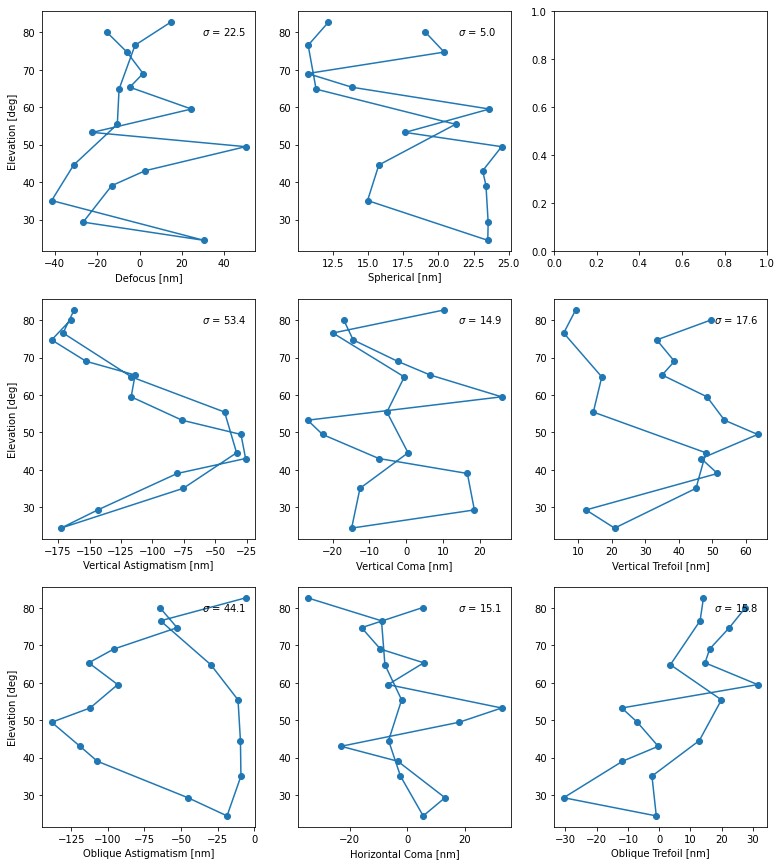
- The WFE shows significant astigmatism, except we have no way to control this. The trefoil is fairly minimal but it’s unclear if there is a trend or this is noise dominated.
8 Stellar Motion due to Mirror Motion from datasets from July 8, 2021
Reduced using July8Notebook.
This dataset is the same as the dataset taken on the 7th, except the CWFS measurements are taken and no correction in pointing or collimation is applied. The point of this test is to directly measure the stellar position offsets and WFE induced by the non-repeatability in the mirror tilt. Because the LUT in the hexapod is still active, only residuals are measured.
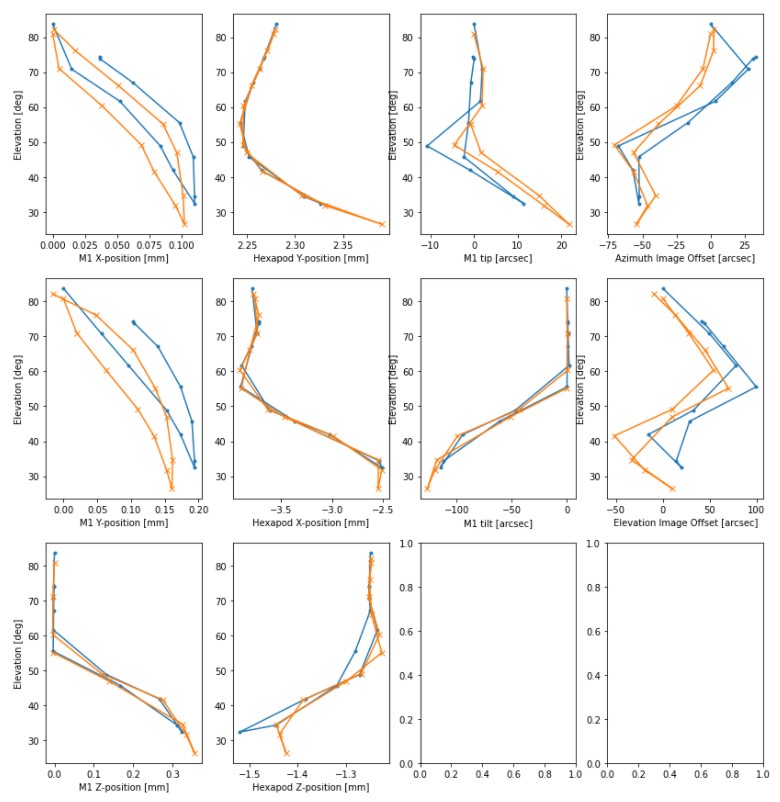
Figure 14 Measurements taken to using the LUT for the hexapod with the M1 position measurement system in place. The orange and blue curves show two separate runs of the same dataset.
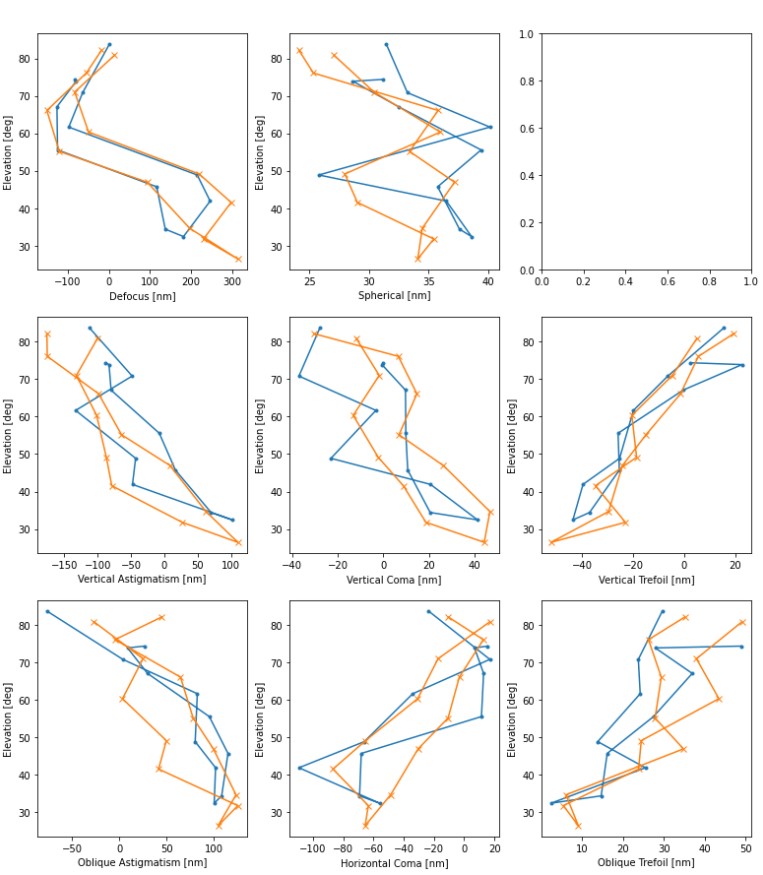
Figure 15 CWFS measurement showing the measured error at each elevation. No corrections from these measurements were applied.
8.1 Conclusions based on data to date
- The tilts in M1 and the image motion seen on the sensor are very similar in shape and size. Even the hysteresis is seen. This is very strong evidence that the M1 motion is causing the pointing non-repeatability.
- The WFE shows large amount of astigmatism and the trefoil curves have different shapes. This makes me inclined to believe there is inaccuracies in the WFE outputs being derived for (at least) these Zernikes.
9 Closed-Dome Pressure Reduction tests from July 15, 2021
Reduced using July15Notebook.
On July 15th, a series of closed-dome tests were performed to look at how reducing the pressure under M1 relates to the mirror motion. It was determined that a reduction in pressure by 10% of the maximum results in the mirror not tilting (or lifting) a significant amount.
10 On-Sky Pressure Reduction tests from July 27, 2021
Reduced using July27Notebook.
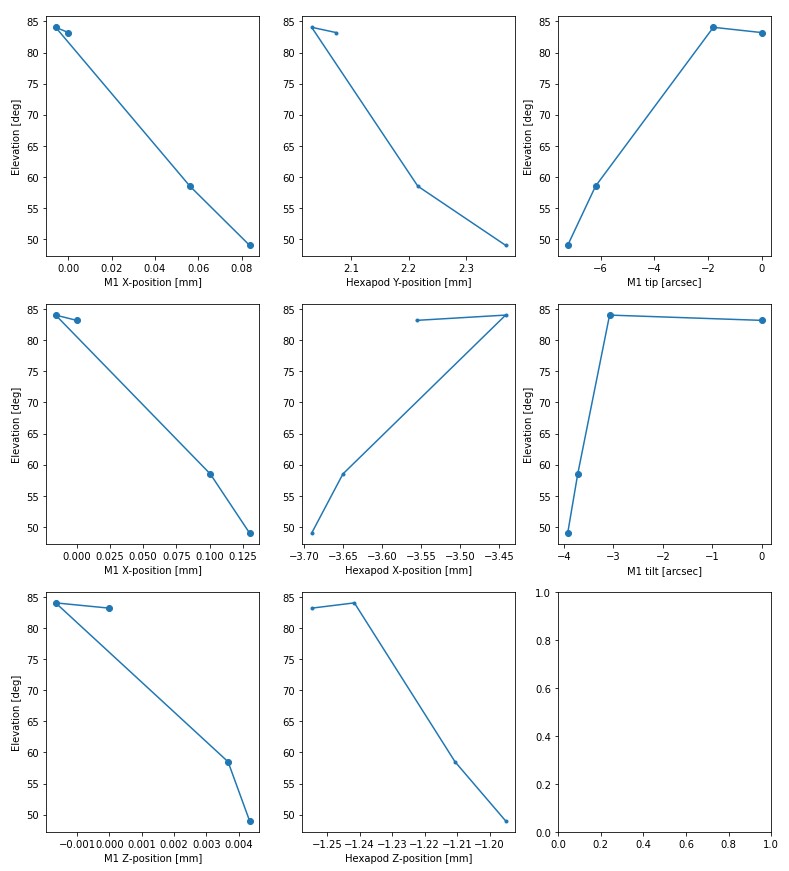
A very quick on-sky test was performed to look at image quality for the reduced pressure. Collimation and Focus were performed at each position since it was known the hexapod LUTs would no longer apply. The following plot shows how the motions of M1 and hexapod are greatly reduced. By eye, the images looked reasonable, but no detailed analysis was performed as we know this to be a (very) non-ideal and unrealistic LUT.
11 Tensioning the Top-end Spider Vanes, August 12, 2021
Based on an FEA_analysis by Myung Cho, the top-end spider vanes were torqued to their proper values in order to ensure no top-end motion should occur. Ideally this would mitigate both any suspected windshake and hysteresis due to the vanes going between compression and tension.
During the tensioning, performed by Roberto Tighe and Mario Rivera, no tilting of the hexapod was observed. It is expected that the alignment for the run should be pretty close to what it was previously.
12 Deriving a new M1 Look-up Table
The data discussed in this section was taken using M1_mirror_testing-2021-08-09 and reduced using M1_Mirror_motion-ClosedDomeTests-2021-08-09.
The original M1 LUT was derived according the proceedure detailed in TSTN-012. In this new M1 LUT, the pressure is determined by looking at what the maximum pressure can be applied before lifting the mirror (and therefore seeing a large tilt). In short, a series of runs moving the telescope over the range in elevations at constant pressures offsets from teh LUT were performed, altering the pressure in intervals of ~1% of the maximum pressure in the original LUT. The invervals were determined by using a scale factor which was used to calculate the pressure offset as follows:
await atcs.rem.ataos.cmd_offset.set_start(m1=starting_pressure*(1-scale_factor))
Therefore a positive scale factor results in a negative offset to the pressure LUT.
Then the piece of each curve right before the mirror lifting extracted as the “best pressure” for each range in elevation. The following shows the mirror motion for each dip in elevation corresponding to different scale factors.
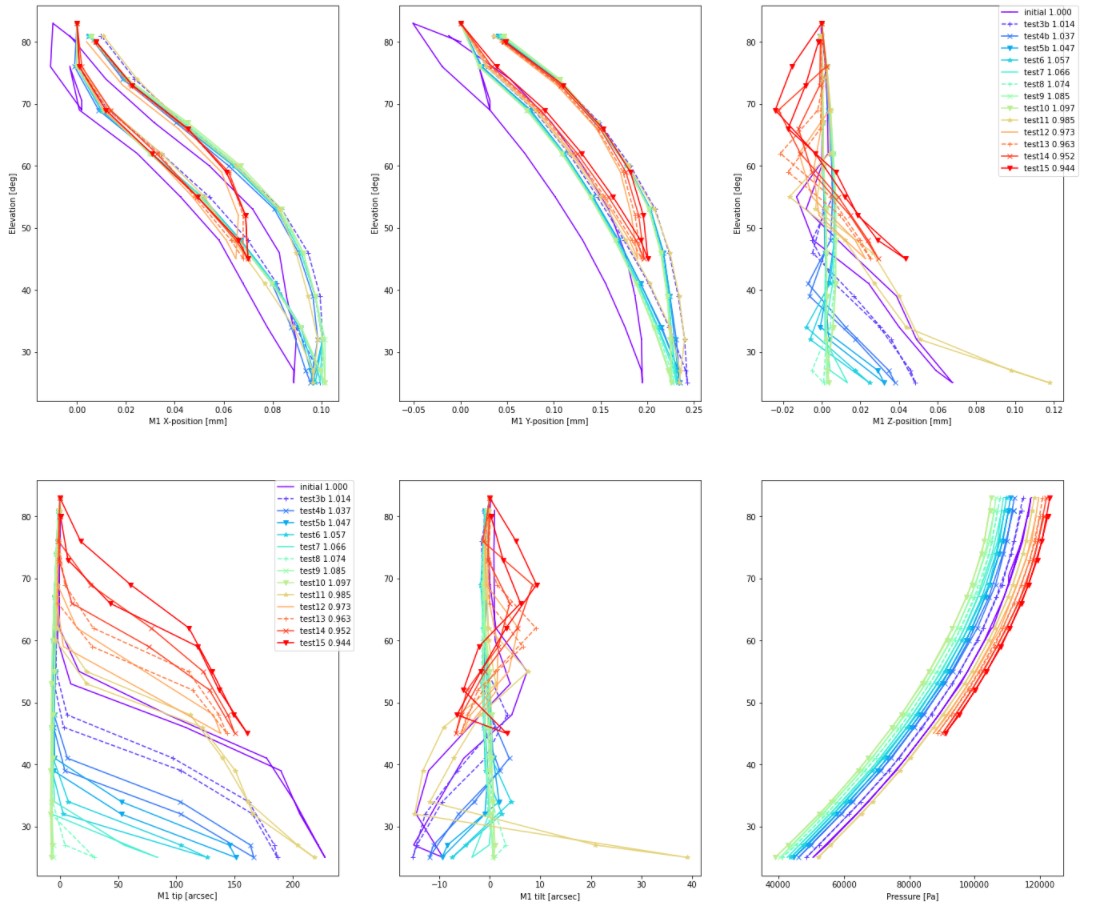
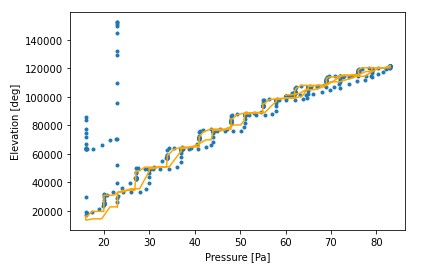
Figure 18 This set of tests shows how the mirror lift varies as a function of pressure applied to M1.
By manually selecting which elevation range from each curve, a new M1 LUT can be derived. The following plot shows what happens when snippets of each curve are used to derive a new pressure versus elevation relationship. The methodology is to fit a polynomial to the pressure vs elevation relationship, then when this function is used it will result in the mirror motions seen in these plots, except smoothed out since it’ll be a continuous function.
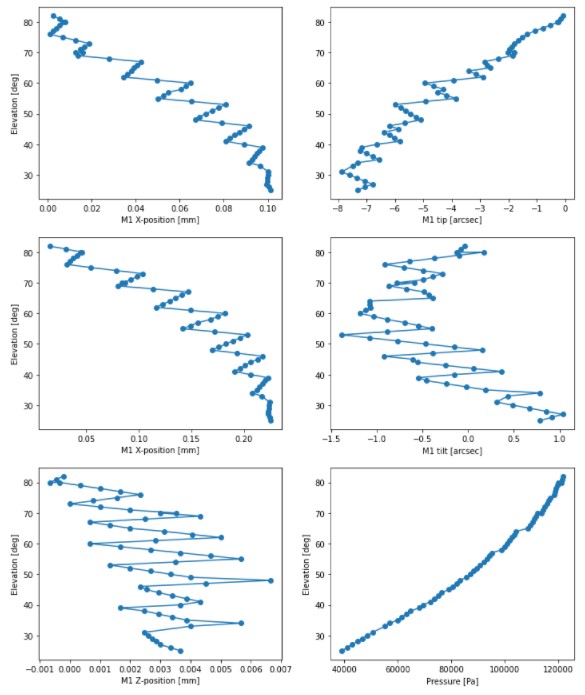
Figure 19 The amalgamation of selected ranges from the runs shown in Figure fig-scalefactors.
To derive the new M1 LUT, which is used in the configuration file that was used for the following observing runs, the following polynomial fit was used. Note that the configuration file includes hexapod LUT values derived from data in the following sections.
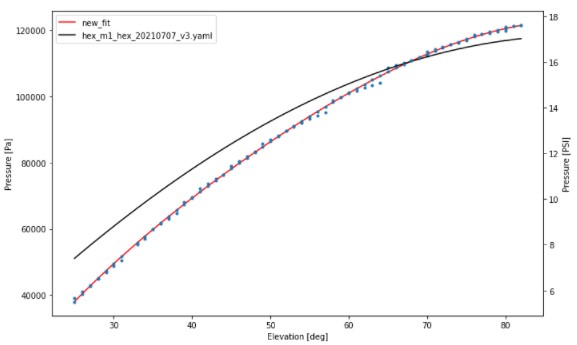
Figure 20 The fit to the newly derived pressure versus elevation relationship based on when the mirror lifts from the hardpoints.
Closed dome tests using this LUT confirmed the performance on 2021-08-12.
12.1 Issues at low elevation
Data in this section was analyzed using M1_Mirror_motion-ClosedDomeTests-2021-08-17.
It has been observed that for elevations below ~27 degrees or so there is an odd behaviour in the measured M1 mirror pressure. It shows that there are spikes in pressure that occur and therefore lift the mirror off the hardpoints. This has been traced to the M1 pressure transducer lower pressure limit. When operated below the limit, then subsequently in the proper range, a spike is seen. A new pressure transducer with a larger range is now being procured. For the following runs we have decided to keep the pressure above ~6.5 PSI, which corresponds to an elevation of ~30 (TBR).
13 Testing the new LUTs - Aug 17, 2021
Data in this section was analyzed using Up-Down-Repeatability-Test-2021-08-17.
The first night of a three night observing run (two nights of which were weathered out), used the new M1 LUT then consisted of:
- Deriving new hexapod LUTs by performing collimation and focus at multiple elevations
- Deriving a new pointing model
- Testing the image quality by performing dips in elevation and observing the PSF FWHM compared to the DIMM measured seeing.
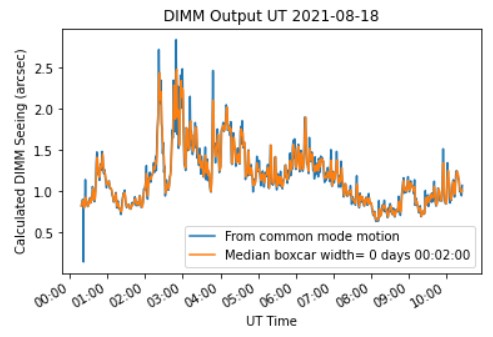
The data used to derive the hexapod LUTs consisted of performing collimation and focus for a range of elevations. The average PSF was also determined and compared against the measured DIMM seeing. It should be noted that the seeing data was quite variable throughout the night, but did contain regions of decent seeing. None of the testing performed during this night made any effort to align with good seeing patches, the observations came with whatever seeing was currently occurring.
The following figure shows the difference in PSF width and DIMM seeing as a function of the elevation for the dataset used to derive the hexapod LUT. Because a collimation and focus sequence is run at each position, one would naively expect to see a small offset between the measured DIMM values and measured PSFs from LATISS, combined with a dependence on the elevation.
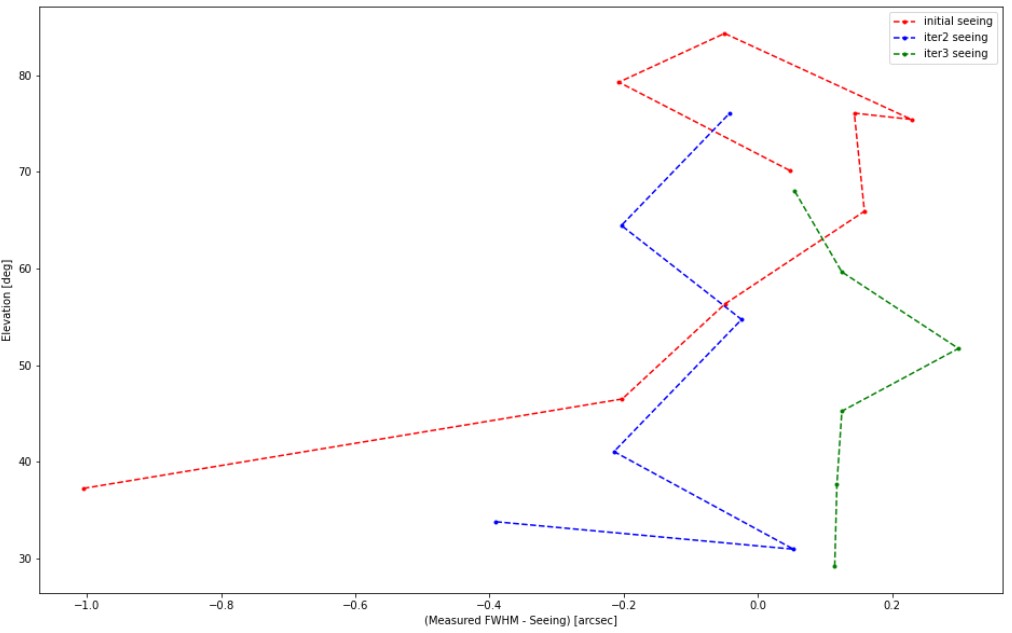
Figure 23 The measured offsets between the measured seeing an DIMM measurements are relatively small, but very noisy. Surprisingly there is no elevation dependence, however, during the three sequences the seeing values ranged from 0.8 to 1.4 arcseconds if the large outliers (one in red and one in blue, which correspond to the same outliners in this plot) are omitted.
The WFE measured at each position (after collimation and focus) is shown in the following plot. Again, curious amounts of astigmatism and trefoil appear
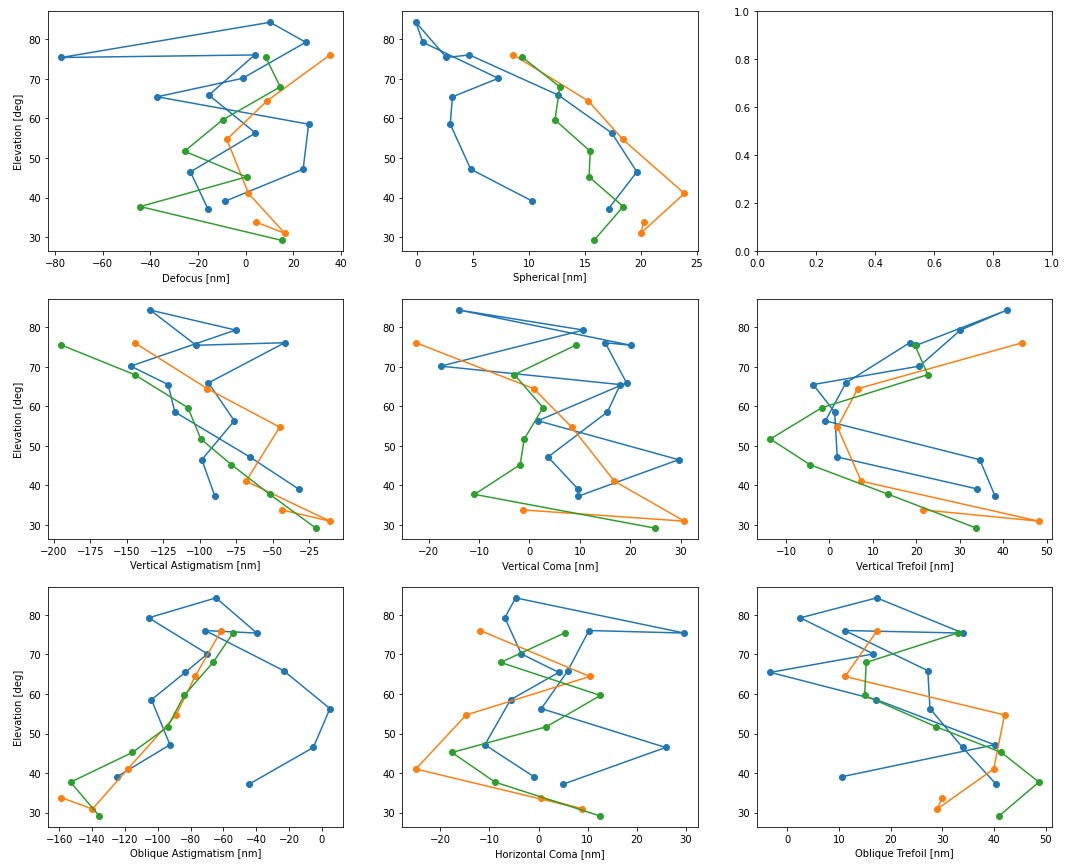
Figure 24 The measured Zernikes after collimation+focus correction for each elevation for each dataset. The coma and defocus (which are controlled by the hexapod) are well corrected, the astigmatism and trefoil values are interesting but suspect to errors.
13.1 Verification of the LUTs from Imagery Data
Data in this section was analyzed using Up-Down-Repeatability-Test-2021-08-17-Verification.
Two dips in elevation were performed taking imagery data (and not CWFS measurements) at multiple elevations. All corrections were performed using the ATAOS and LUTs only. Seeing ranged from ~0.85 to ~1.3 and there were no major outliers.
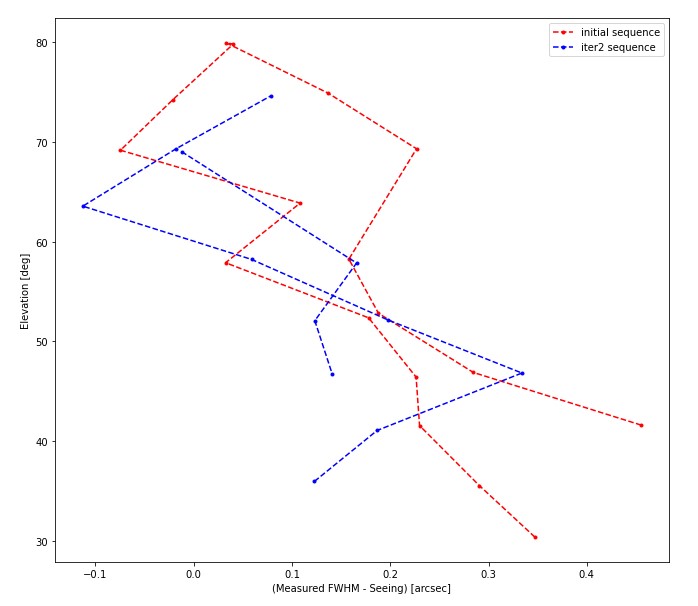
Figure 25 The measured offsets between the measured seeing an DIMM measurements are relatively small, but an azimuthal dependence is observed.
It is possible that the azimuthal dependence comes from mirror hysteresis, but it could also be a result of the atmosphere. More data in more stable conditions are required to properly identify and diagnose remaining issues.
13.2 Verification of the Pointing Data
The pointing improved very noticably due to the higher repeatability of the measurements since the M1 tilting issues have been mitigated. An early pointing model based on a small number of stars was loaded and used and showed remarkable improvement. A new pointing model has been created, based on a larger but still relatively low number of stars, which has a ~5 arcsec RMS. Unfortunately, this new model could not be verified due to the remainder of the run being weathered out.
13.3 Conclusions based on data to date
- The tilting in M1 is now greatly reduced and is much smaller in magnitude (~10 arcsec) and hysteresis (~2 arcsec).
- Any issues from M2 motion are not easily separable using the on-sky data but if issues remain they appear small.
- There is still suspect behaviour in the CWFS data, particularly in the astigmatism and possibly the trefoil data
- A lack of azimuthal dependence in data used to derive the LUT suggests mirror and/or dome seeing is dominating the PSF aberrations. This is also consistent with requiring long (~20s) images to get stable PSFs.
- The pointing has improved significantly but is still requires verification and a more detailed model.
- The pressure transducer for the M1 pneumatics system requires replacement prior to moving to lower altitudes.
